Quick jump |
|
To create a new report, click the Create Report button on the start page and follow the steps to configure the report.
The Back and Next buttons allow you to move to previous and next pages correspondingly. Use the Jump to button to jump to any page in the report creation. The Save button saves the report and redirects you to the start page. Use the SQL Query button to view the SQL query and its results. The Preview button allows you to preview the report.
You can find the description of the report creation steps below.
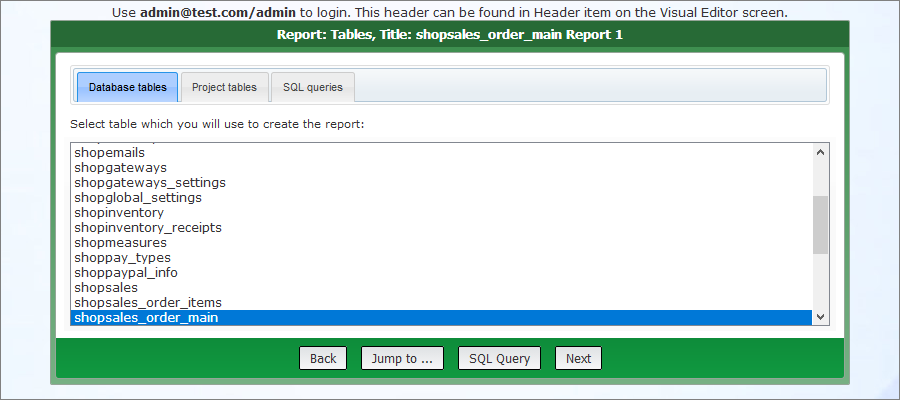
This page allows you to choose a table or an SQL query as a data source for your report.
•All tables in the database are available for selection. User tables (custom views) are not available.
•When viewing a report, user permissions for the tables (static and dynamic permissions, advanced security options) and "view/edit" field settings do not work. You need to edit the permissions for each report on the Dynamic permissions page.
•During the report configuration, you can create table relations (SQL joins) to query data from two or more tables and add additional search conditions using the WHERE clause.
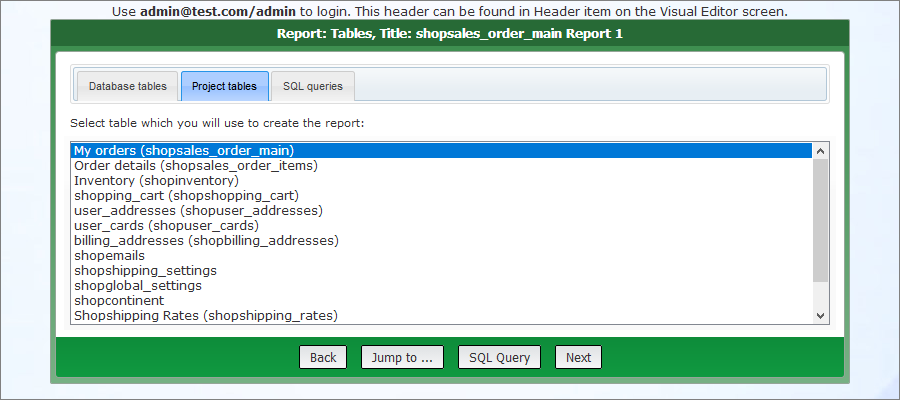
•All tables and custom views added to the project in the left panel of the Datasource tables screen are available for selection.
•When viewing a report, user permissions for the tables and "view/edit" field settings work as usual.
•During the report configuration, you are not able to create table relations (SQL joins). The SQL queries defined on the SQL query screen in ASPRunnerPro are used to query the data for the report.
•The tables for selection are displayed as Caption (table title), e.g., My orders (shopsales_order_main).
This tab allows you to select the queries created on the Custom SQL page as a data source for your report.
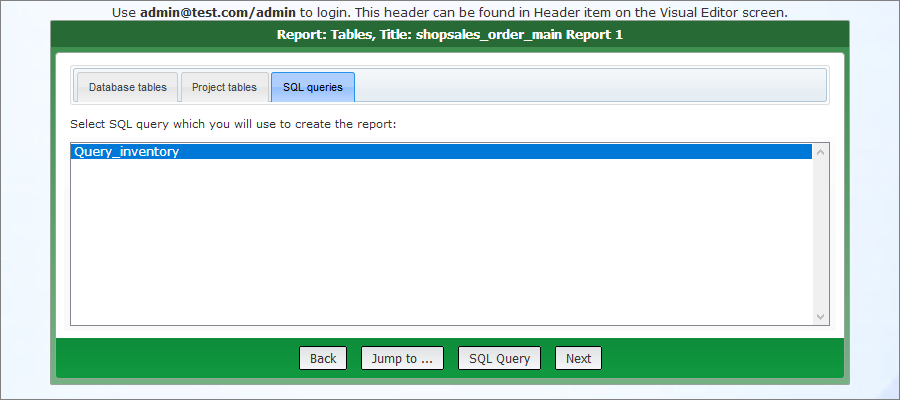
Note: this page becomes available if you selected a table from the Database tables tab as a data source.
On the Table relations page, you can create table relations (SQL joins) to query data from two or more tables, based on the relationship between certain fields in these tables. You can add Inner Join, Left Join, Right Join, and Full Outer Join.
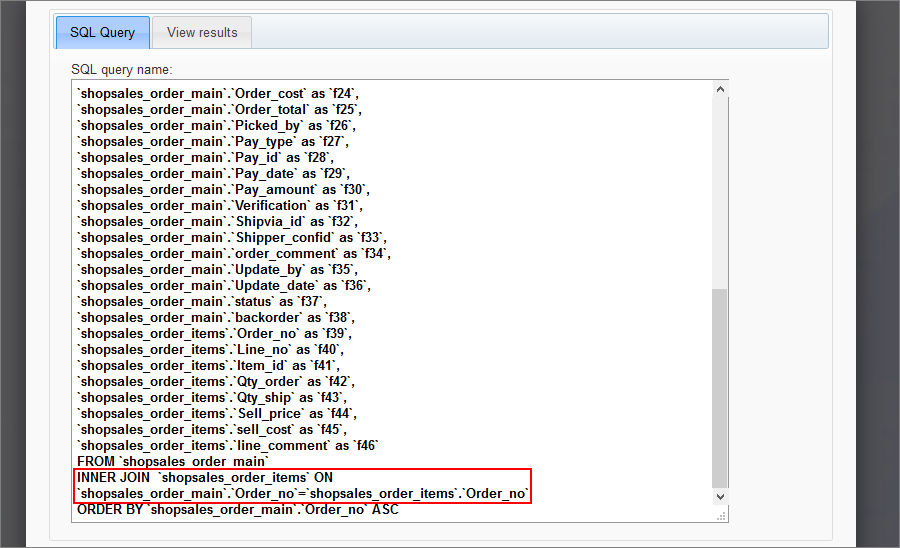
To add an SQL join, choose tables and fields to be joined, pick one of the join types, and click Add Relation. The JOIN clause is added below the SELECT clause.
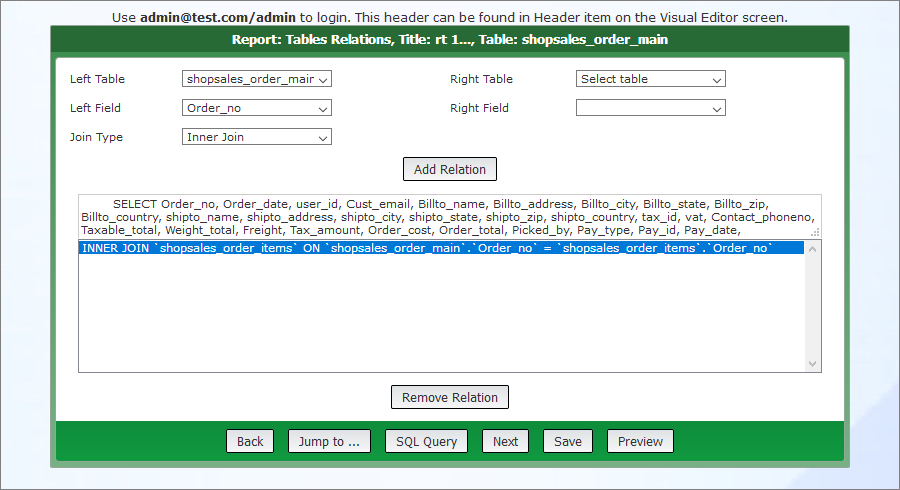
Note: you can add several table relations.
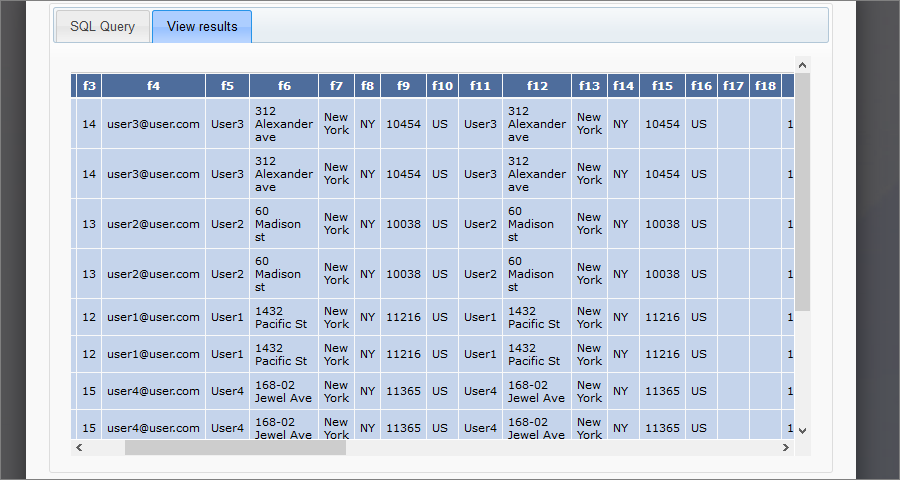
Use the SQL Query button to view the complete SQL query and its results.
Here is how the query looks like for the example above:
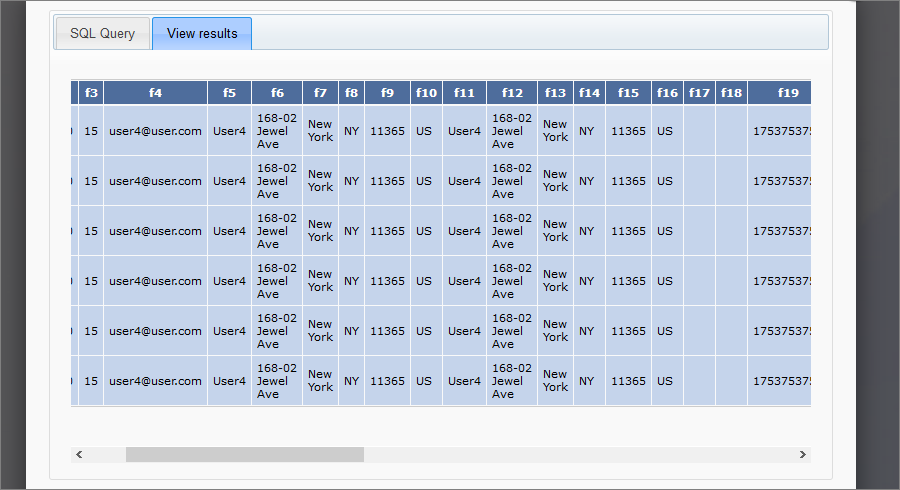
Here is how the results look like for the example above:
Use the Remove Relation button to delete the selected table relation.
Note: this page becomes available if you selected a table from the Database tables tab as a data source.
On the WHERE condition page, you can add additional filter conditions using the WHERE clause. Select the field and type in the filter criteria using the text boxes on the right. The filter should be added as <operator><value>. E.g., ='USA'; =2009; <>'red'; >10.
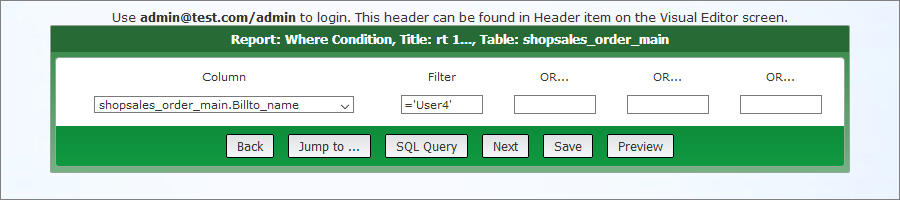
Note: if you need several criteria, fill in the first one. Additional fields appear after you reload the page.
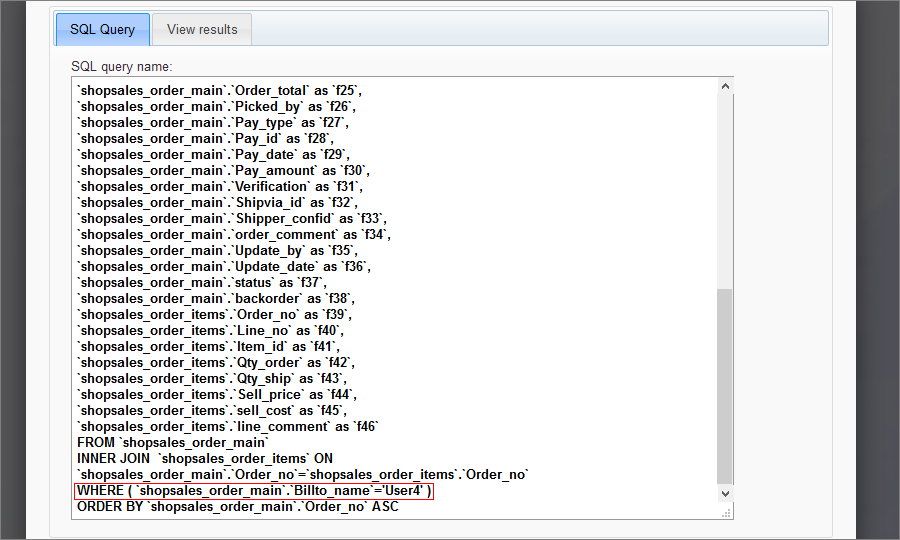
Use the SQL Query button to view the complete SQL query and its results.
Here is how the query looks like for the example above:
Here is how the results look like for the example above:
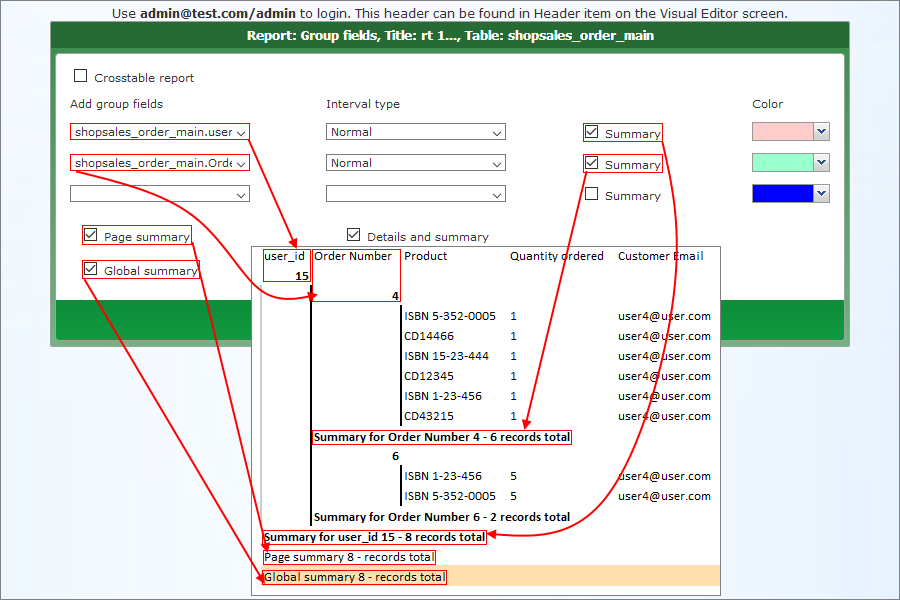
On the Group fields page, you can group the results by one or more columns. The following picture explains how this page works.
See also:
•Creating and configuring reports: Group fields
If you clear the Details and summary checkbox, only the summary is shown in the report.
You can use other interval types, besides Normal (a new group starts when the group field value changes). Available interval types are different for each data type.
On the Totals page, you can choose what fields to display in the report and specify their labels. You can also apply aggregate functions like MIN, MAX, SUM, and AVERAGE. The results of these calculations are displayed after each group and at the end of the page/report.
Use arrows on the left of the field names to change the order of the fields.
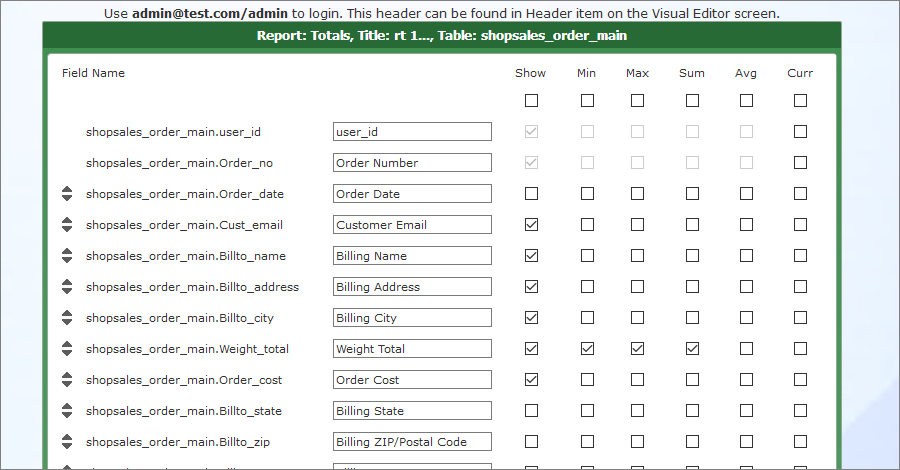
Note: you can't modify the settings for the group fields.
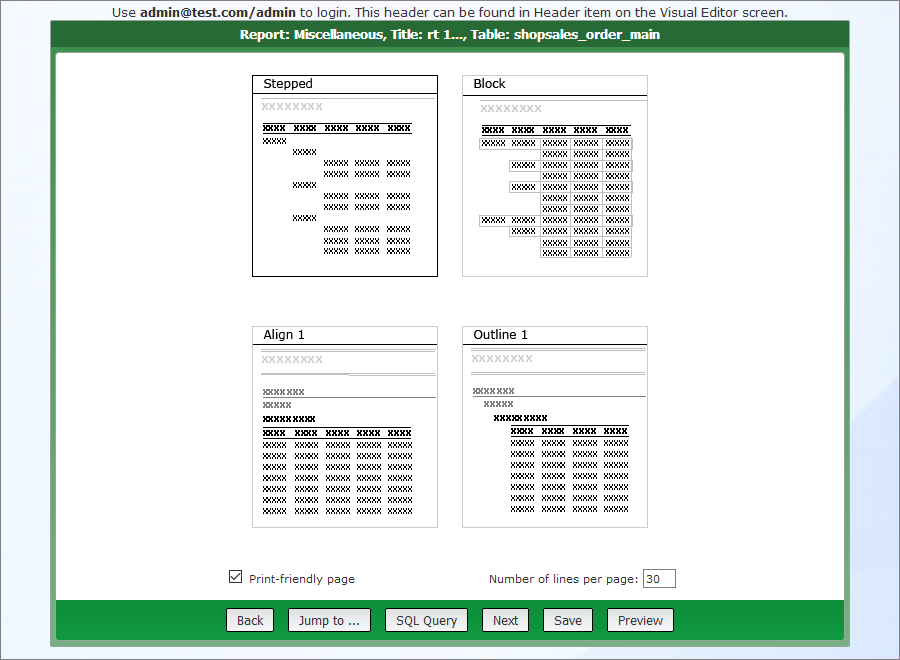
On the Miscellaneous page, you can choose the report layout. If you use grouping, you can choose between Stepped, Block, Outline, and Align layouts. If you don't use grouping, you can use only the Tabular layout, which is similar to the default List page.
The Print-friendly page checkbox enables/disables the following features:
•printing the whole report or its page using a printer-friendly version;
•opening the report as a Microsoft Word or Microsoft Excel document.
Use the Number of lines per page option to determine where to insert the page break, when you print the entire report.
On the Sort fields page, you can define the sort order for the records in the report.
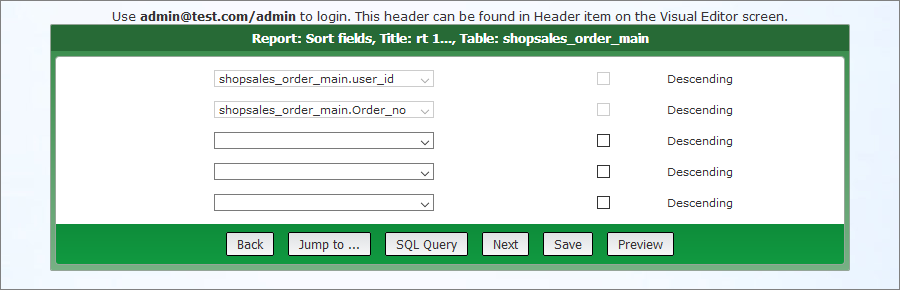
Note: you can't modify the settings for the group fields.
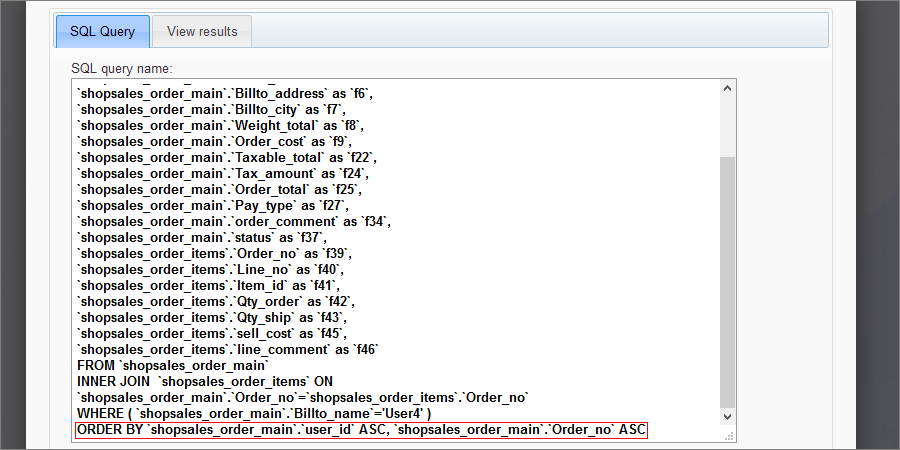
Use the SQL Query button to view the complete SQL query and its results.
Here is how the query looks like for the example above:
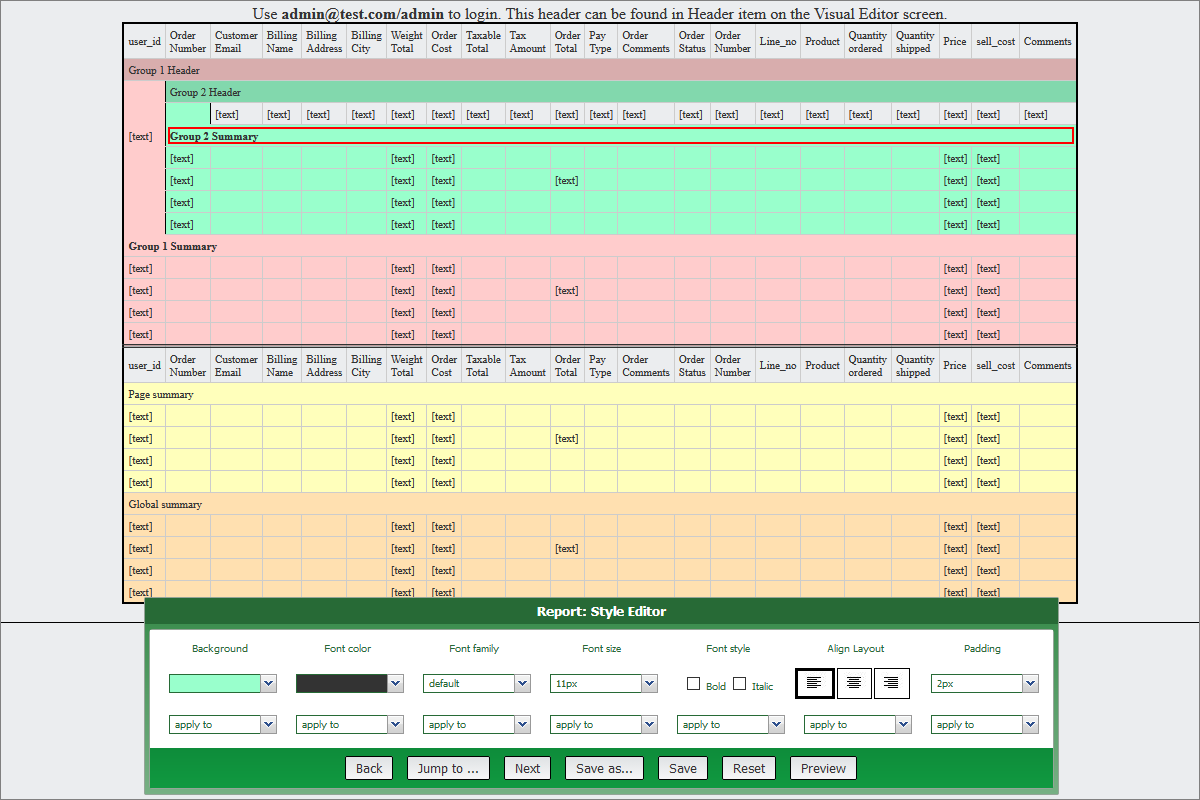
On the Style Editor page, you can define the font settings and background color for the cells in the report.
Select the cell and define the style settings for it. Using the apply to dropdown, you can apply the selected style to a group (row), field (column), or the entire report. Use the Reset to default button to return to default settings.
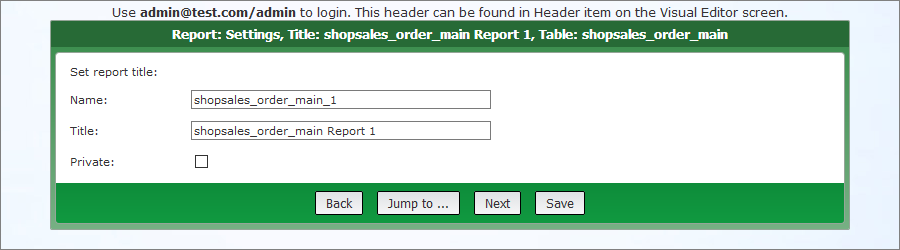
On the Settings page, you can define the report name and title. If your project uses Security settings, you also have an option to make the report private. Private reports are not accessible by anyone but the owner. Non-private (public) ones appear under the "shared" section on the start page.
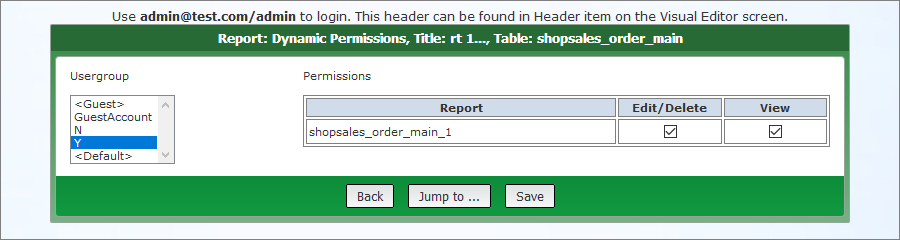
Note: this page is available if you enabled dynamic permissions in ASPRunnerPro and the report is not marked as private on the previous step.
On the Dynamic permissions page, you can assign user group permissions to view/edit/delete the report.
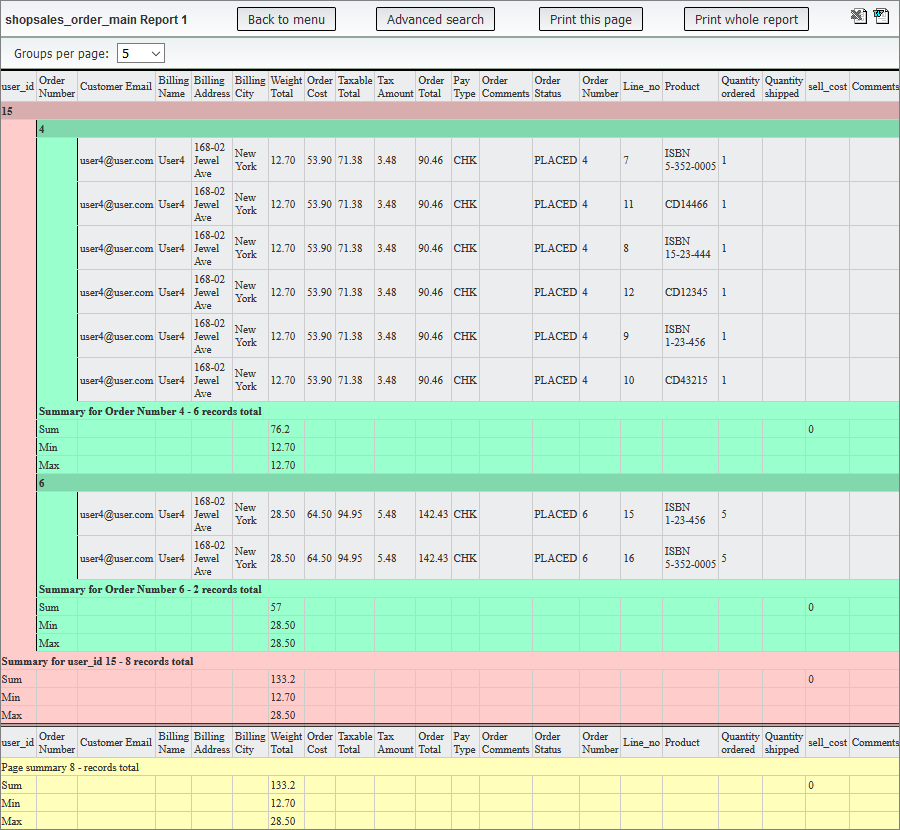
Here is how the resulting report looks like:
See also:
•Creating and configuring reports