Quick jump |
|
To create a new chart, click the Create Chart button on the start page and follow the steps to configure the chart.
The Back and Next buttons allow you to move to previous and next pages correspondingly. Use the Jump to button to jump to any page in the chart creation. The Save button saves the chart and redirects you to the start page. Use the SQL Query button to view the SQL query and its results. The Preview button allows you to preview the chart.
You can find the description of the chart creation steps below.
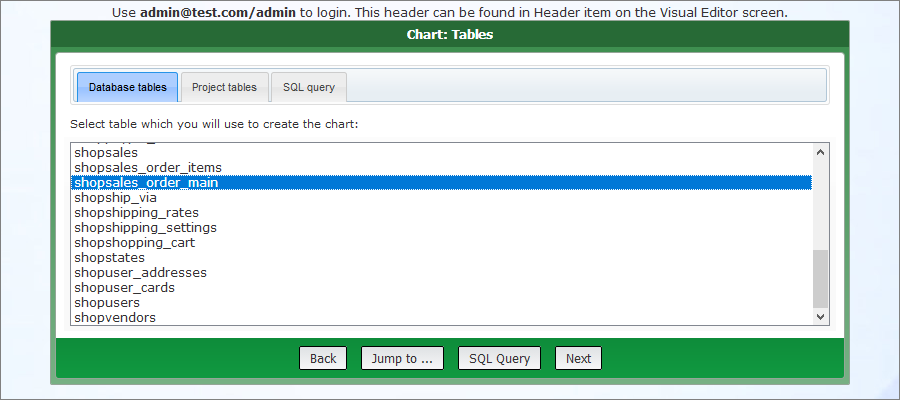
This page allows you to choose a table or an SQL query as a data source for your chart.
•All tables in the database are available for selection. User tables (custom views) are not available.
•When viewing a chart, user permissions for the tables (static and dynamic permissions, advanced security options) and "view/edit" field settings do not work. You need to edit the permissions for each chart on the Dynamic permissions page.
•During the chart configuration, you can create table relations (SQL joins) to query data from two or more tables and add additional filter conditions using the Group by page.
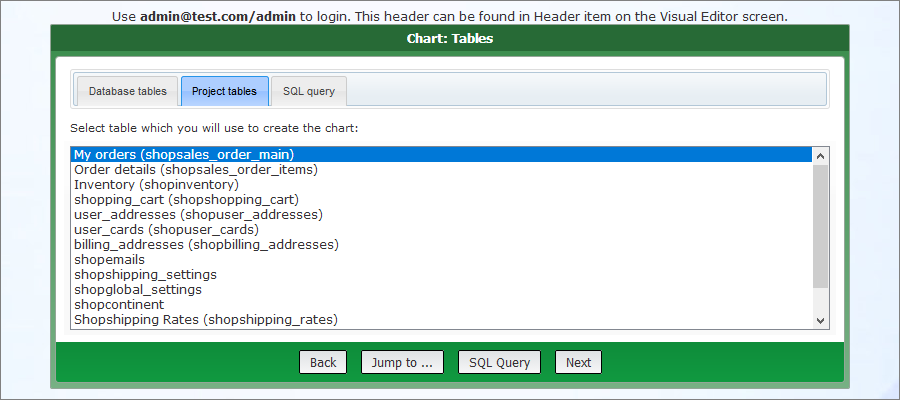
•All tables and custom views added to the project in the left panel of the Datasource tables screen are available for selection.
•When viewing a chart, user permissions for the tables and "view/edit" field settings work as usual.
•During the chart configuration, you are not able to create table relations (SQL joins). The SQL queries defined on the SQL query screen in ASPRunnerPro are used to query the data for the report.
•The tables for selection are displayed as Caption (table title), e.g., My orders (shopsales_order_main).
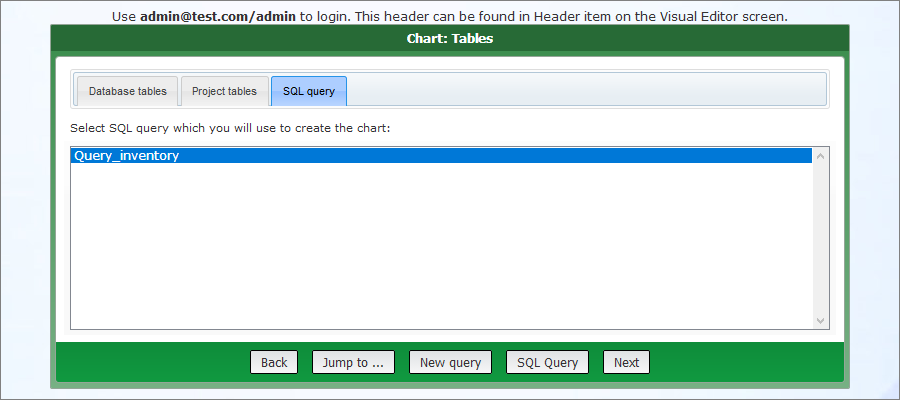
This tab allows you to select the queries created on the Custom SQL page as a data source for your chart.
Note: this page becomes available if you selected a table from the Database tables tab as a data source.
On the Table relations page, you can create table relations (SQL joins) to query data from two or more tables, based on the relationship between certain fields in these tables. You can add Inner Join, Left Join, Right Join, and Full Outer Join.
To add an SQL join, choose the tables and fields to be joined, pick one of the join types, and click Add Relation. The JOIN clause is added below the SELECT clause.
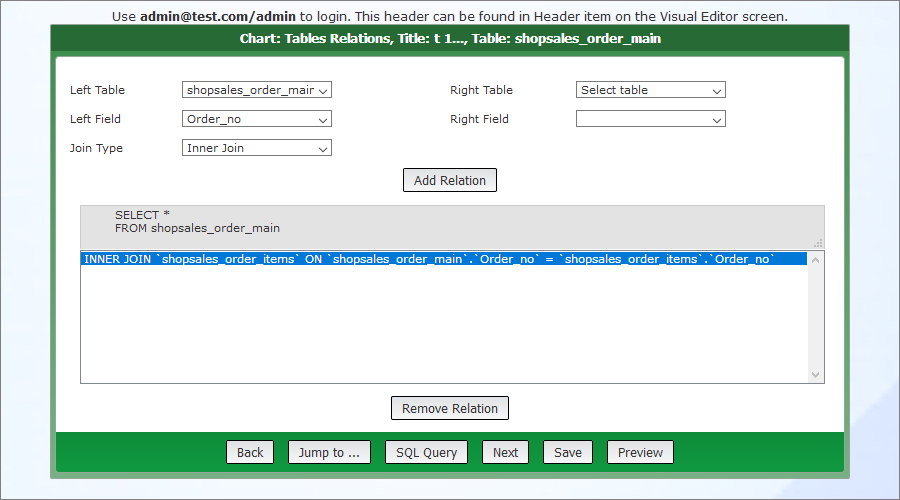
Note: you can add several table relations.
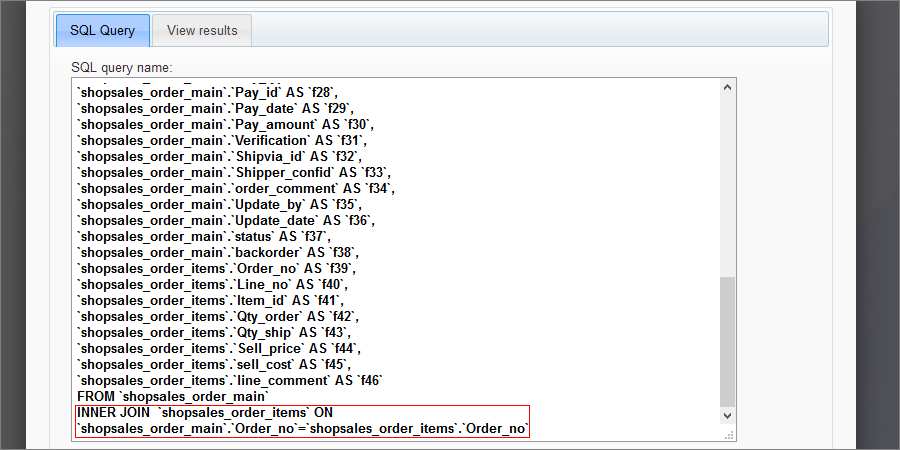
Use the SQL Query button to view the complete SQL query and its results.
Here is how the query looks like for the example above:
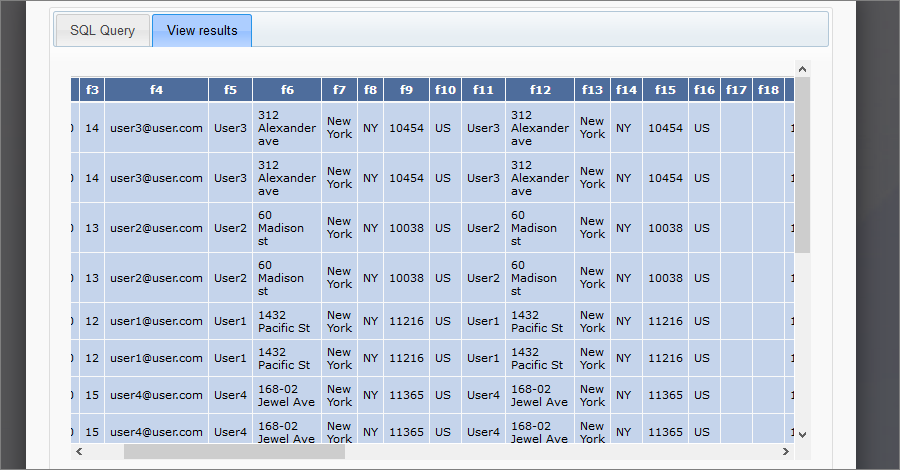
Here is how the results look like for the example above:
Use the Remove Relation button to delete the selected table relation.
Note: this page becomes available if you selected a table from the Database tables tab as a data source.
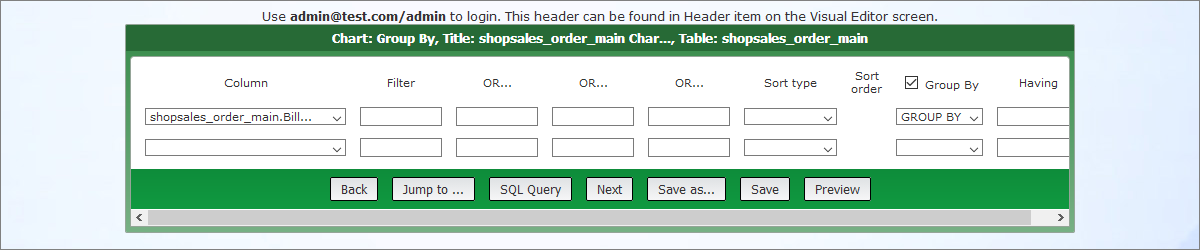
On the WHERE condition page, you can add additional filter conditions using the WHERE clause. Select the field and type in the filter criteria using the text boxes on the right. The filter should be added as <operator><value>. E.g., ='USA'; =2009; <>'red'; >10.
You can also choose the Ascending/Descending sort type to sort the records in the chart. Select a field in the first column and choose the sort type and sort order to do so.
Additionally, you can group the results by one or more columns and apply aggregate functions like MIN, MAX, SUM, AVERAGE, and COUNT. Select a field in the first column, enable the Group By checkbox, and choose one of the values in the dropdown under this checkbox.
You can filter the records that the GROUP BY clause returns using the HAVING clause. Type in the condition as <operator><value> in the text box under Having to do so. E.g., >10 or = 500.
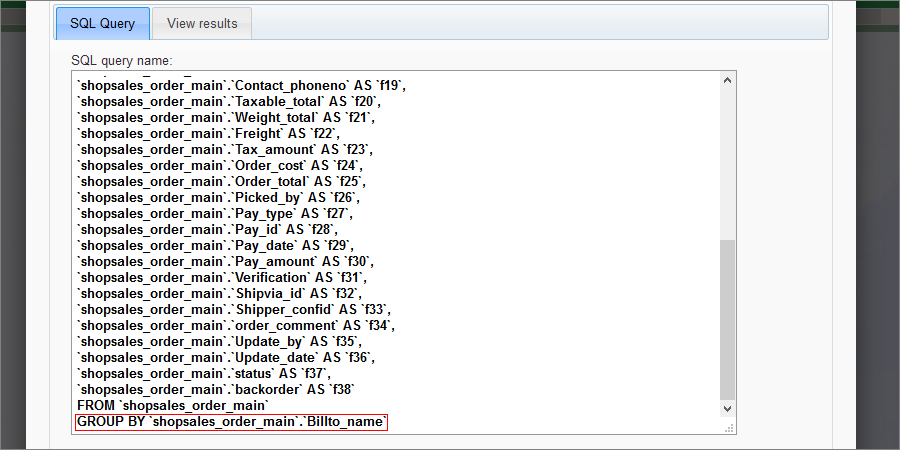
Use the SQL Query button to view the complete SQL query and its results.
Here is how the query looks like for the example above:
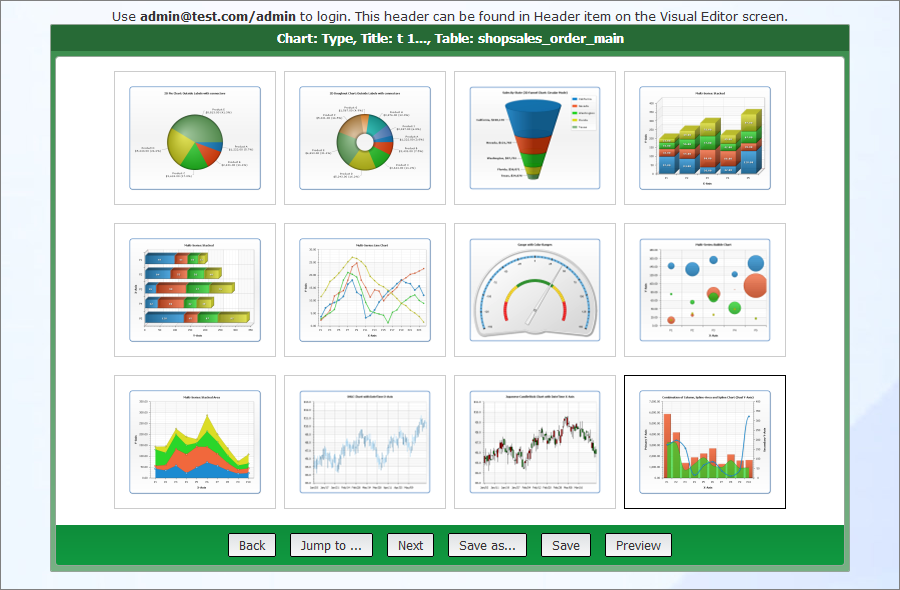
On the Type page, you can select one of the chart types. For more information, see Chart types.
On the Parameters page, you can choose the Data series fields (fields with data) and the Label field (field with data labels).
You can add any number of Data series fields. Additional Data series dropdown boxes appear automatically once you've used the available ones.
For more information about choosing the Data series fields for certain chart types, see Chart types.
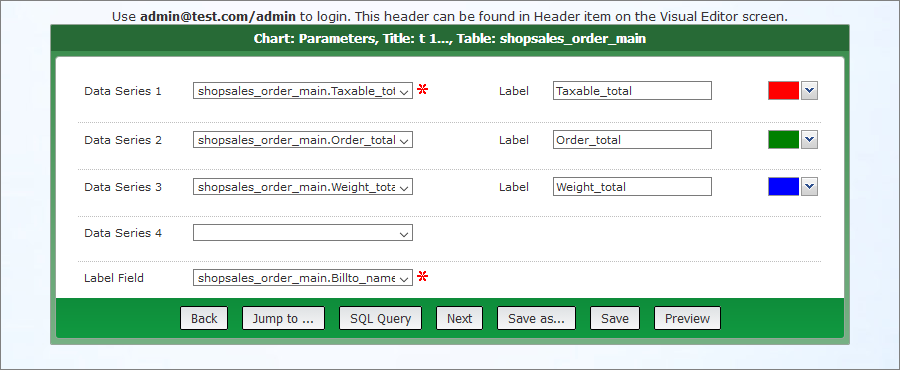
Note: only the numeric fields are available to be chosen as the Data series.
The Label text boxes allow you to change the labels of the Data series fields.
The Color dropdowns define the colors of the Data series fields.
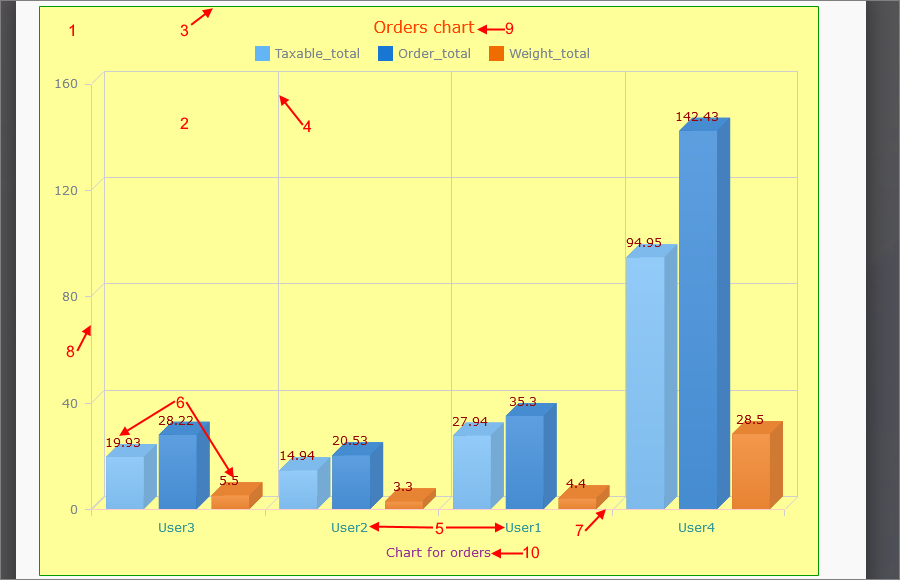
On the Appearance page, you can configure the chart appearance on the web page. The following two pictures show how changing the different colors affects the resulting Column chart.
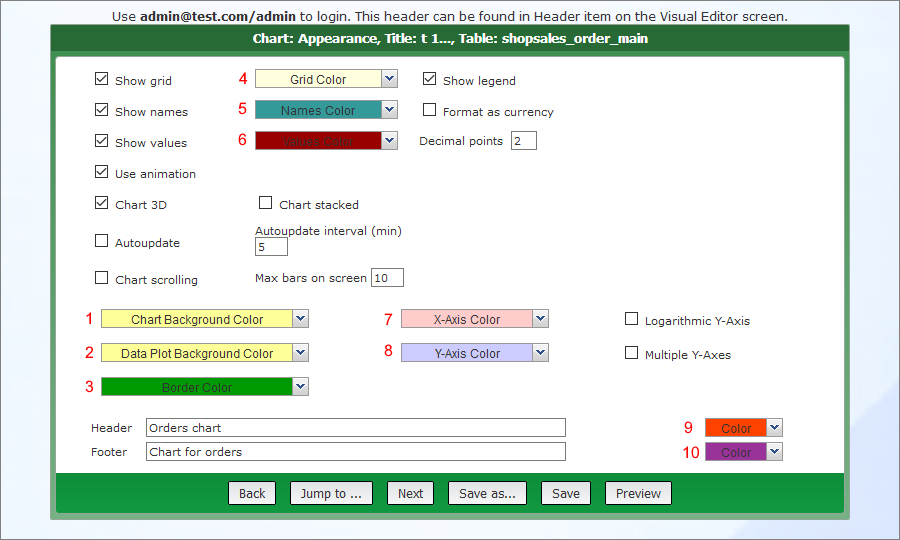
•Select the Autoupdate checkbox to auto-refresh the chart every N seconds.
•The Use animation checkbox enables the chart animation upon opening a chart.
•Use the Logarithmic Y-Axis option to convert a linear value axis to a logarithmic value axis.
If you select one of the 2D charts (e.g., 2D Column chart), additional options become available:
•Use the Chart 3D option to build a 3D chart instead of a 2D one.
•Use the Chart stacked option to display a chart where the chart elements are stacked on top of each other.
The Y-axis label input box appears only if you have multiple Data series fields.
For more information about each chart type settings, see Chart types.
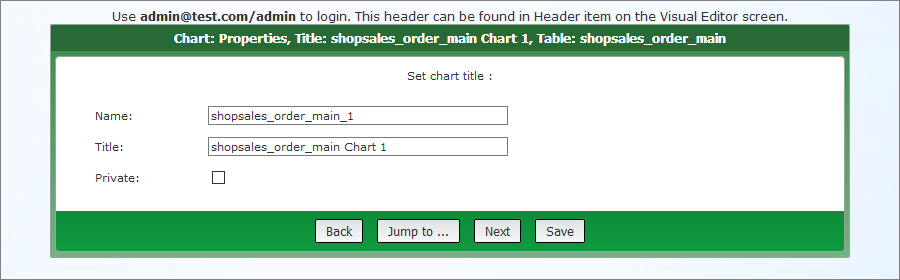
On the Properties page, you can define the chart name and title. If your project uses Security settings, you also have an option to make the chart private. Private charts are not accessible by anyone but the owner. Non-private (public) ones appear under the "shared" section on the start page.
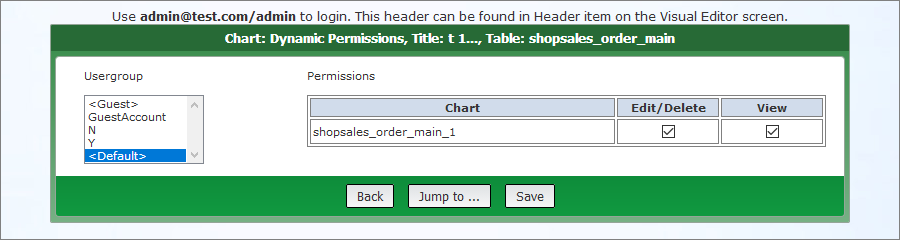
Note: this page is available if you enabled dynamic permissions in ASPRunnerPro and the chart is not marked as private on the previous step.
On the Dynamic permissions page, you can assign user group permissions to view/edit/delete the chart.
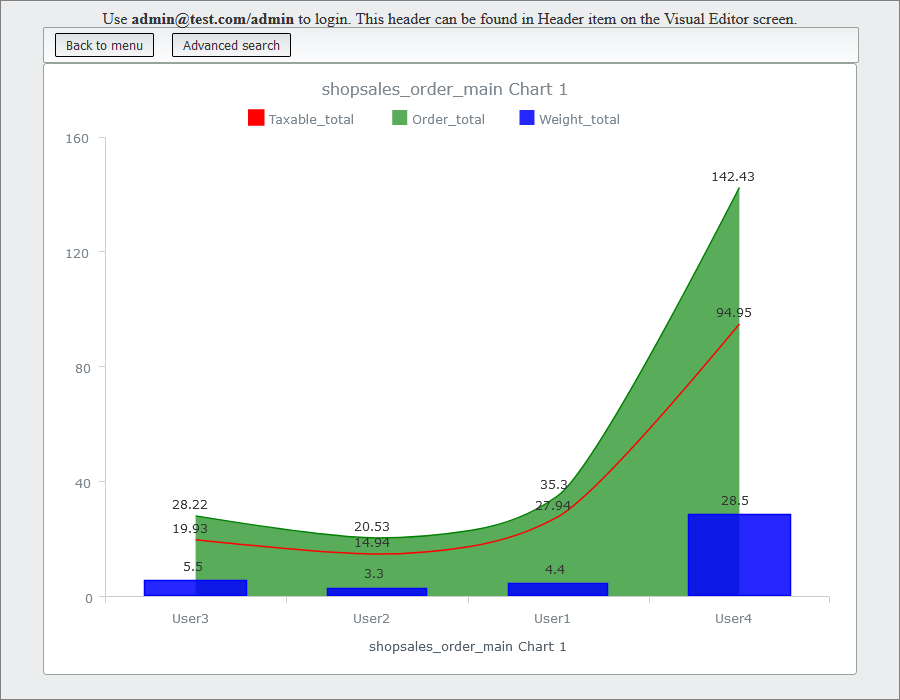
Here is how the resulting Combined chart looks like with the default appearance settings.
See also: