To create a report:
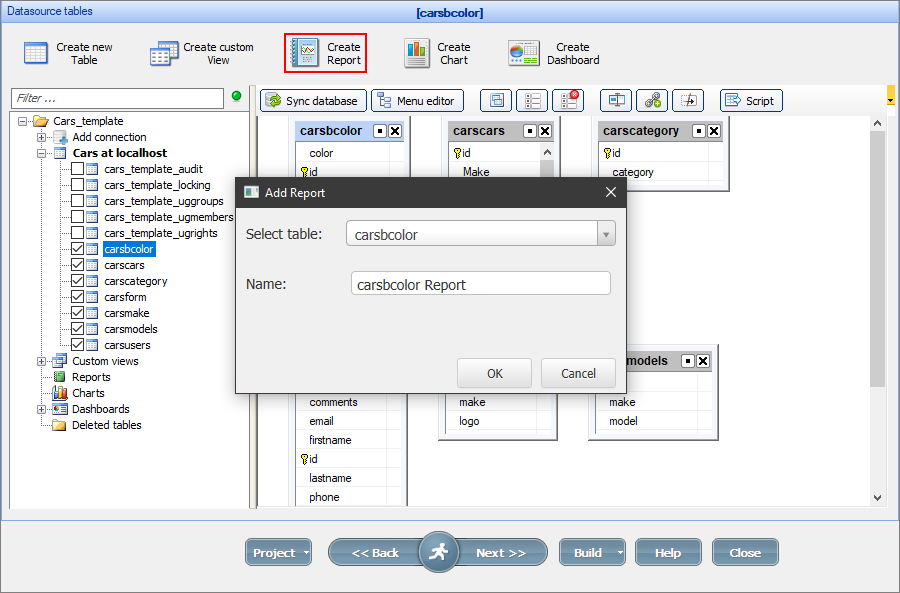
1. Proceed to the Datasource tables screen and click Create Report.
2. Select the table, type in the report name, and click OK.
Note: you can create a copy of an existing report (right-click the report and select Copy).
On the next several screens (use the Next button to navigate) you can:
•make the changes to the SQL query. More info about editing SQL queries;
•choose group fields and grouping types;
•set up the report totals and layout.
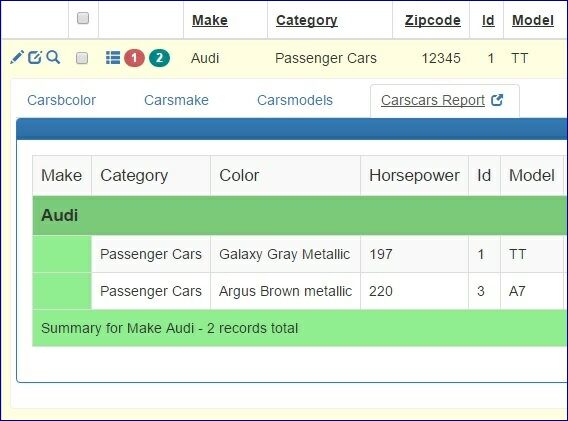
Note: you can use reports with both master and details tables. For more information, see Master-details relationship between tables.
A report as a details table:
On the Report: Group fields screen you can select the group fields, grouping intervals, and summary types.
You can choose between standard and cross-tab reports.
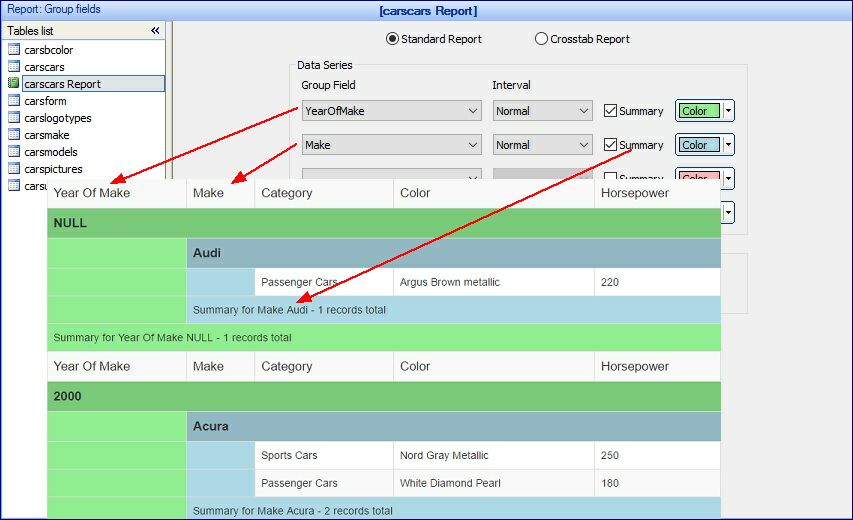
Clear the Show details and summary checkbox to make the report page show only the summary.
You can choose the Interval for the group field. Available interval types are different for each type of data.
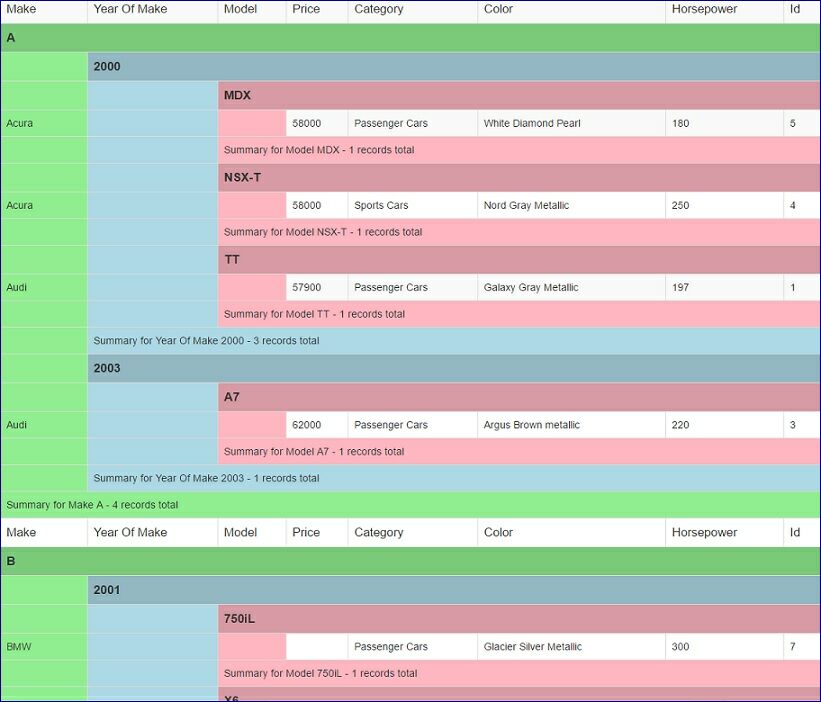
Here is an example of a report with a text group field using the first letter as an interval:
ASPRunnerPro supports cross-tab reports (often called pivot tables). On the Group fields screen, you can choose two or more variables (columns) and assign them to the X or Y-axis. You can assign more than one variable to the axis and switch between them in the generated report.
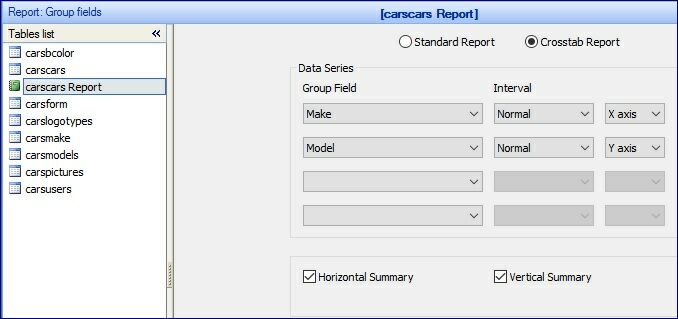
On the Report: Totals screen, you can choose the totals options like Min, Max, Sum, and Average.
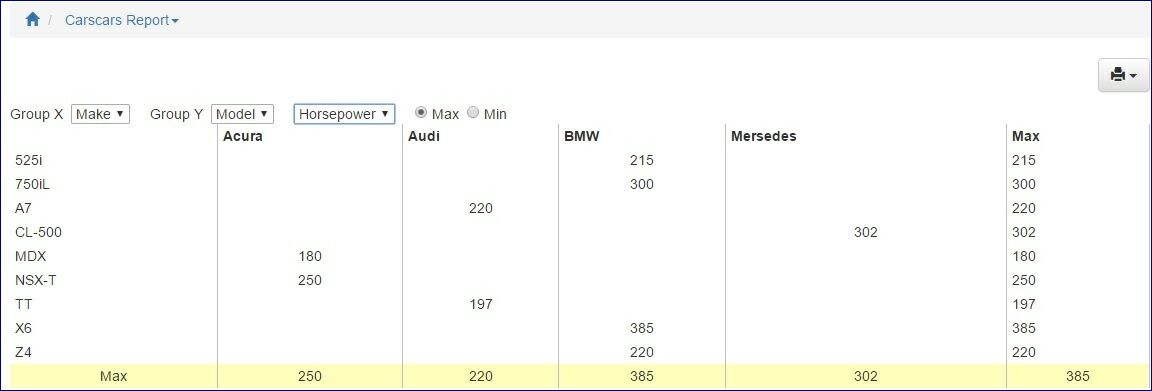
Here is how a cross-tab report looks like in the generated application. You can select the variables, totals types, and data fields to display.
See also:
•Master-details relationship between tables